
Economic Impact & Carbon Assessment Toolkit
Quantifies what an energy-efficiency or decarbonisation programme actually returns — energy saved, emissions avoided, fiscal effect and employment — and ranks measures by cost per tonne.
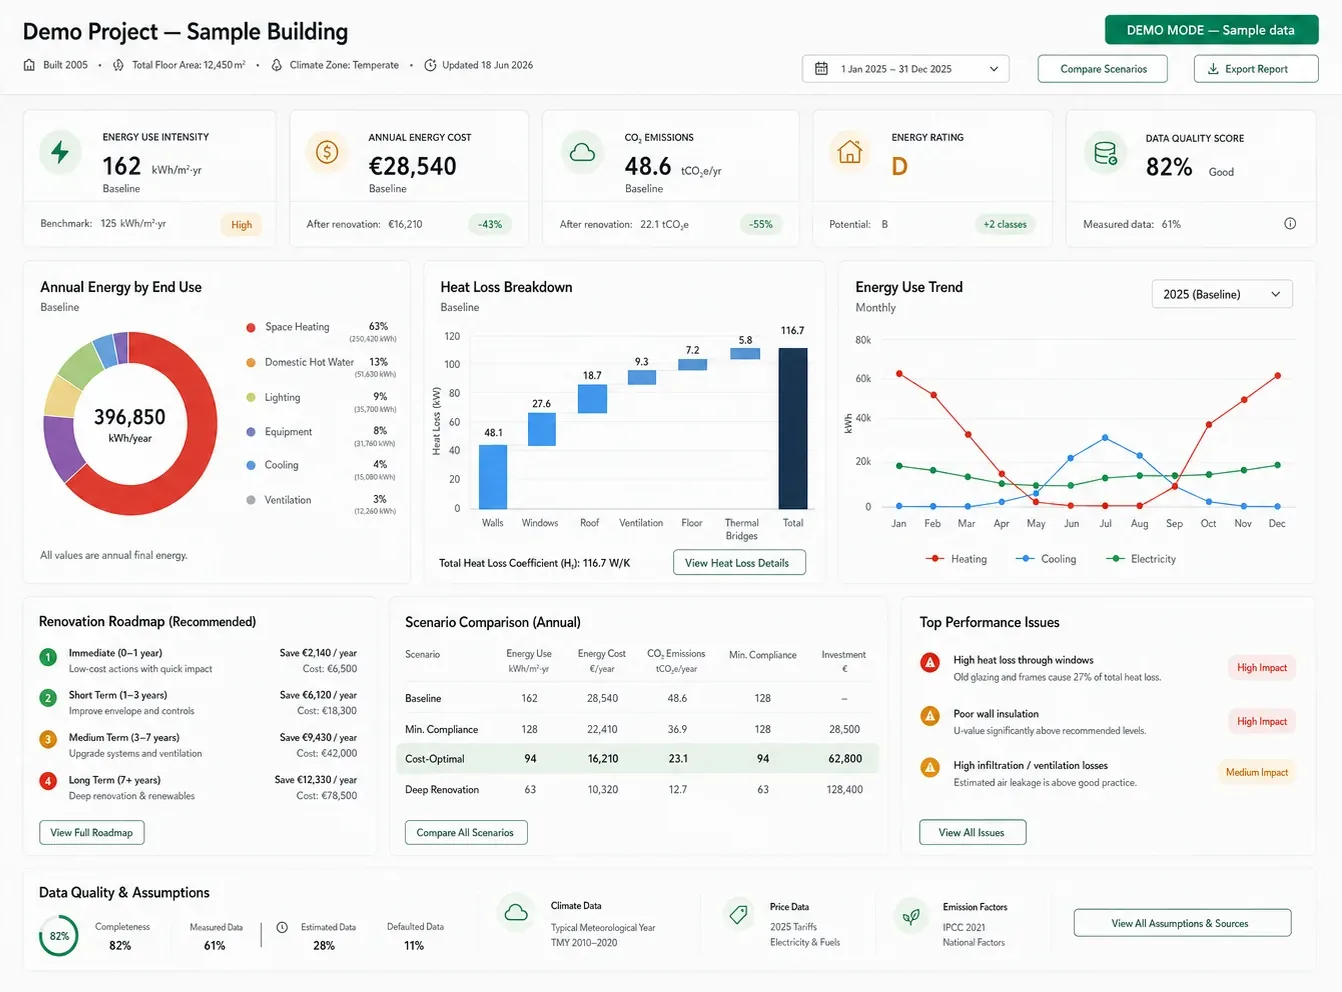
What it looks like
Decision supported
Which measures to fund first, what the programme returns against what it costs, and what can be defended to a finance ministry or a donor board.
Intended user
Ministries, municipalities, donor programmes and institutions with a reporting obligation or an investment case to make.
What goes in, what comes out
- Programme or building-portfolio scope
- Capex and opex by measure
- Baseline consumption and, where available, metered data
- Emission factors and, where relevant, carbon price assumptions
- Macroeconomic parameters for multiplier effects
Economic Impact & Carbon Assessment Toolkit
- Energy savings and CO₂ reduction by measure and in aggregate
- Marginal Abatement Cost Curve ranking measures by cost per tonne
- Fiscal return and employment effects
- KPI scorecard and dashboards structured for reporting
What goes in and what comes out. The model itself — its formulas, weighting and optimisation logic — is method, not proof, and is not drawn here.
Methodology summary
An integrated model linking capital and operating flows to energy, emissions and macroeconomic outcomes, with each layer separable so a reviewer can interrogate one without unpicking the rest. The same structure underpinned a national energy-efficiency impact assessment delivered for UNDP Kosovo in 2025.
Limitations
- Macroeconomic multipliers are parameters, not measurements. They are stated explicitly and varied in sensitivity rather than presented as single-point truth.
- Savings estimates are ex-ante. Verified savings require metering after implementation, which is a separate exercise the toolkit is designed to hand over to.
- Emission factors depend on the grid mix assumed; in a system decarbonising quickly, the avoided-emissions figure moves with it.
Public preview
Access model
Applied within an engagement, with methodology documentation for institutional reuse.